
This week we look at the young star TT Ori, which is situated just North of the Orion Nebula M42. It was flagged up by Gaia as an alter (Gaia22ehy) some years back. We have looked at parts of its light curve a few times in the past (week 199, week 230, week 253). Thus, it is now time to have another look at the object.
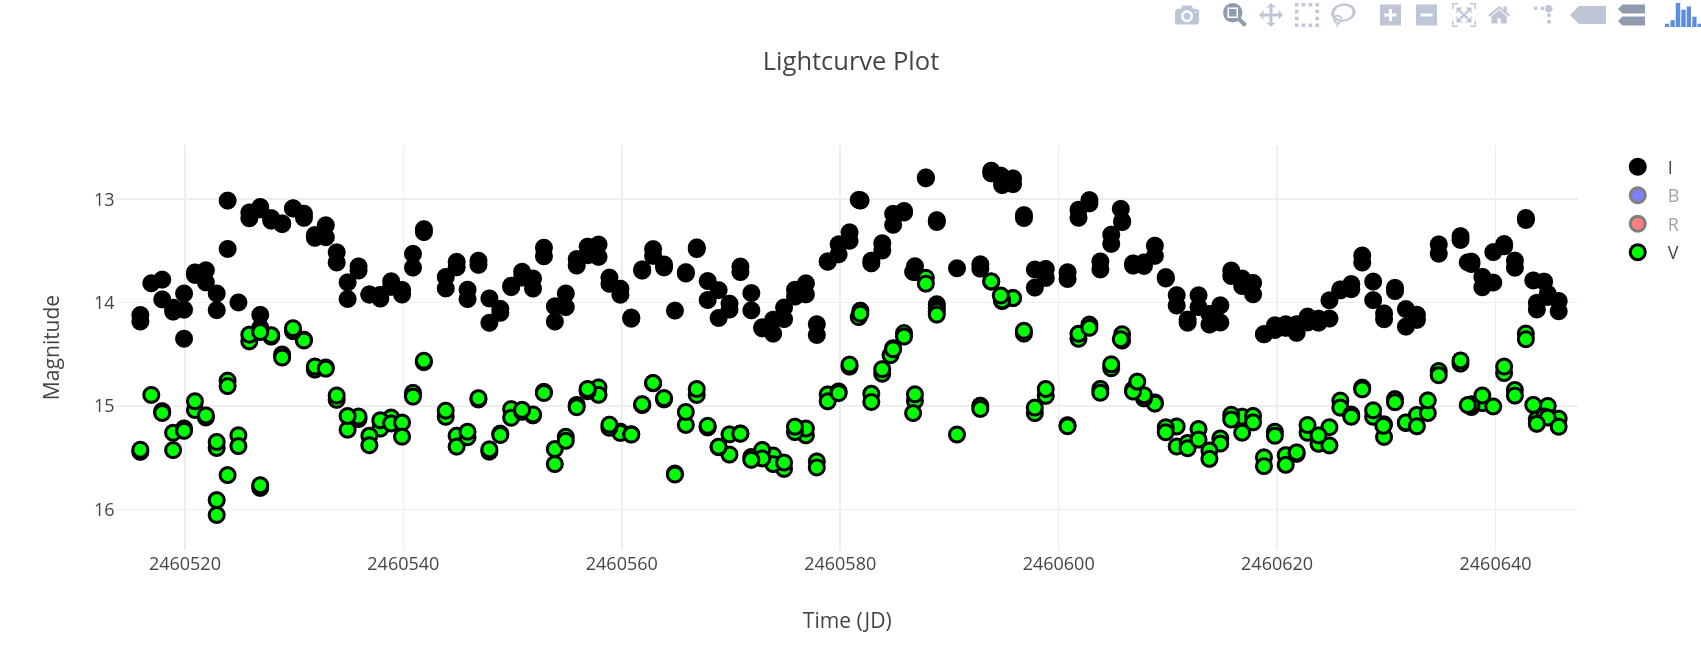
We show the V and I-band data from a few weeks ago in the above image. The source shows the typical T-Tauri star like behaviour. It varies by up to one magnitude on a number of timescales. There are about half magnitude variations on a week’s timescale. These (currently) seem to form the baseline behaviour. On top of that we see longer brightening events with an amplitude of 1mag. These are interspersed with very rapid short term variations of the same magnitude.
The star is constantly changing the behaviour and we encourage people to use the light curve plotting tool on the website to investigate other parts of the data that is not shown in the plot above. Please note, that we still only have the data for the last ~2yr available online.